Click below to learn more about waste in:
Canada
Newfoundland and Labrador
Prince Edward Island
Nova Scotia
New Brunswick
Quebec
Ontario
Manitoba
Saskatchewan
Alberta
British Columbia
Northwest Territories
Yukon
Nunavut
Overview of waste in Canada
* This is based on the data available from 2022, excluding Prince Edward Island that had an ever lower waste production and waste per capita in 2020 than any other province or territory.
Active Solid Waste Assets in Canada, 2022
This graph shows how many active solid waste assets there are in each province and territory. In total, there are 3,543 active assets in Canada and 800 of them are located in Ontario. The second most common location for waste assets is Alberta where 746 of them are located. There are 688 assets in Saskatchewan, 382 in British Columbia, 358 in Manitoba, 252 in Quebec, and 142 in Newfoundland and Labrador. In Nova Scotia, there are 58 assets, in New Brunswick there are 36, in the Northwest Territories there are 34 assets, in Yukon there are 24 assets, in Nunavut there are 15 assets, and in Prince Edward Island there are 8 solid waste assets. These numbers were calculated from the total number of solid waste assets excluding inactive assets (Statistics Canada, 2022).
Waste per capita in Canada, 2022
*The data from the Northwest Territories, Yukon, Nunavut, and Prince Edward Island was collected in 2020.
This graph shows how much residential waste per capita is produced in each province and in the territories. Alberta has the highest waste per capita at 0.39 tonnes, followed by Quebec at 0.38 tonnes, Saskatchewan at 0.35 tonnes, New Brunswick at 0.31 tonnes. Both Newfoundland and Labrador and the Northwest Territories, Yukon, and Nunavut have 0.30 tonnes per capita respectively. The waste per capita of Ontario is 0.25, for Manitoba it is 0.23, and for British Columbia it is 0.21. In Nova Scotia, the waste per capita is 0.18, and the lowest waste per capita is found in Prince Edward Island at 0.13 tonnes (Statistics Canada, 2024).
Waste production in Canada, 2022
*The data from the Northwest Territories, Yukon, Nunavut, and Prince Edward Island was collected in 2020.
This graph shows the total waste production from both residential and non-residential sources in Canada mainly in 2022. Ontario is the main producer at 10,738,742 tonnes, followed by Quebec at 5,875,625 tonnes, Alberta at 4,967,775 tonnes, and British Columbia at 2,845,820 tonnes. In Manitoba, 899,282 tonnes of waste were produced, and similarly, 859,521 tonnes were produced in Saskatchewan. In New Brunswick 504,726 tonnes were produced, in Nova Scotia 412,942 tonnes were produced, and in Newfoundland and Labrador 364,313 tonnes were produced. The Northwest Territories, Yukon, Nunavut produced 96,295 tonnes and Prince Edward Island produced 55,802 tonnes (Government of Canada, 2024).
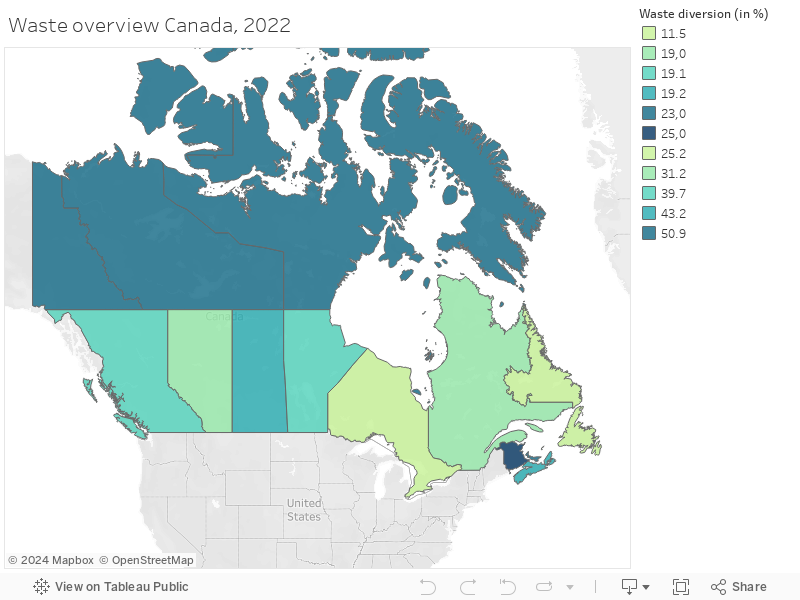
Diversion of waste in Canada, 2020
The diversion rate of waste in Canada was highest in Prince Edward Island at 50.9%, followed by 43.2% in Nova Scotia, 39.7% in British Columbia, 31.2% in Quebec, 25.2% in Ontario, and 25.0% in New Brunswick. In the Northwest Territories, Yukon, and Nunavut, the diversion rate was 23.0%, in Saskatchewan it was 19.2%, in Manitoba it was 19.1%, in Alberta it was 19.0%, and in Newfoundland and Labrador it was merely 11.5% (Statistics Canada, 2022).

Residential vs. Non-Residential waste in Canada in 2020
In 2020, 10,862,118 tonnes of waste (41.6%) was generated by residential sources in Canada, while 15,245,602 tonnes of waste (58.4%) was generated by non-residential sources.
In total, 26,107,720 tonnes of municipal solid waste was generated in Canada in 2020.

Waste production in Canada 2012-2022
Overall, Canada’s waste disposal in all provinces and territories from non-residential sources decreased slightly between 2012 and 2016 as it went from 14,996,859 tonnes of waste to 14,714,804 tonnes, reflecting a decrease of merely 1.9 %. It did however almost return to its 2012 value in 2020 as there was an increase from 2016 to 15,919,008 tonnes in 2022, reflecting an increase of 8.2 %.
There was however an accelerating increase of residential waste in all of Canada between 2012 and 2018, reflected by an increase of 12.0 % from 9,684,615 tonnes in 2012 and 10,848,238 tonnes in 2018. Then, there was a slight increase of 0.1 % to 10,862,118 tonnes in 2020, before a slight decrease by 1.5 % to 10,698,180 tonnes in 2022 (Statistics Canada, 2024).
Waste per capita in Canada 2012-2022

The national waste per capita value for residential waste in 2022 was 0.28 tonnes, based on a population count of 38,027,406 people. The waste per capita generally increased by 16.0 % from 0.25 in 2012 to 0.29 in 2018, and it then remained relatively stable until 2022.
The national waste per capita value for non-residential waste was 0.42 tonnes in 2022. The waste per capita has generally increased by 7.7 % from 0.39 tonnes in 2012 to 0.42 tonnes in 2022 (Statistics, Canada, 2024).
Composition of residential waste in Canada, 2022

For residential waste in Canada in 2022, 2,366,630 tonnes were organic waste (32.2%), 1,445,597 tonnes were paper fibers waste (19.7%), 1,299,011 tonnes were food waste (17.7%), 955,293 tonnes were yard waste (13.0%), 337,991 tonnes were glass waste (4.6%), 264,715 tonnes were plastic waste (3.6%), and 670,734 tonnes were other forms of waste (9.1%) (Statistics Canada, 2024).
Composition of non-residential waste in Canada, 2022

For non-residential waste in Canada, 2,125,787 tonnes were paper fibers (41.5%), 620,194 tonnes were construction waste (12.1%), 707,291 tonnes were organic waste (13.8%), 592,949 tonnes were ferrous metals (11.6%), 283,639 tonnes were food waste (5.5%), 235,140 tonnes were other organic waste (4.6%), 188,513 tonnes were yard waste (3.7%), and 365,600 tonnes were other forms of waste (7.1%) (Statistics Canada, 2024).
Solid waste assets in Canada, 2022

In Canada, there are a total of 5,069 solid waste assets. Specifically, there are 1,647 transfer station assets, making up the majority (32.5%) of all solid waste facilities in the country. There are also 1,513 closed sites (inactive engineered landfills and dumps) making up 29.8% of the facilities, followed by 590 active dump sites (11.6%), 553 active engineered landfills (10.9%), 402 materials recovery facilities (7.9%), 294 composting facilities (5.8%), and 70 other solid waste facilities (1.4%) (Statistics Canada, 2022).
References
Government of Canada. (2024). Solid waste diversion and disposal. Retrieved June 16, 2024, from https://www.canada.ca/en/environment-climate-change/services/environmental-indicators/solid-waste-diversion-disposal.html
Statistics Canada. (2024). Table 38-10-0138-01 Waste materials diverted, by type and by source DOI: https://doi.org/10.25318/3810013801-eng
Statistics Canada. (2024). Table 17-10-0009-01 Population estimates, quarterly. DOI:https://doi.org/10.25318/1710000901-eng
Statistics Canada. (2024). Table 38-10-0032-01 Disposal of waste, by source DOI: https://doi.org/10.25318/3810003201-eng
Statistics Canada. (2022). Table 34-10-0236-01 Inventory of publicly owned solid waste assets, Infrastructure Canada DOI: https://doi.org/10.25318/3410023601-eng
Government of Canada. (2017). Provincial and territorial symbols. Retrieved August 15, 2024, from https://www.canada.ca/en/canadian-heritage/services/provincial-territorial-symbols-canada.html
Notes
”Misc.” data refers to miscellaneous data, and indicates any form of waste adding up to less than 3.0% individually, added together in one category for better overview.